This is the first post in a series on building a Power BI report on the COVID-19 data. The source of the data is the COVID-19 Data Repository by the Center for Systems Science and Engineering (CSSE) at Johns Hopkins University.
- Part 1: Import COVID-19 Data with Power BI (This Post)
- Part 2: Create a Star Schema with COVID-19 Data in Power BI
- Part 3: Create Simple Reports on COVID-19 Cases with Power BI
- Part 4: Modeling Active COVID-19 Cases with Advanced DAX in Power BI
There are several other blog posts about loading this data, and I want to contribute to the knowledge base as well. A huge thank you to Jamey Johnston [blog|twitter] who inspired this series. While this first post follows many of the steps he used, we will be expanding on this base in the future.
Get Data
The COVID-19 Data Repository is hosted on GitHub and contains a series of CSV files. We will be using the Time Series files because they contain the entire history that is recorded and they get updated each day with new data. Additionally, these files get updated with corrections for prior days when the CSSE adjusts for problems with the data.
We could download the repository and work with the CSV files on the local file system, but then we would have to do this each time we wanted to refresh the data. For that reason, we will be loading the data from the web directly into Power BI.
While browsing on the GitHub page, if we click on time_series_covid19_confirmed_global.csv and then the Raw button (shown below) we will get to a page that is just the CSV data for this file.
 Copy the URL from the address bar. To make it easy, the URL for all of the files we will use are listed here:
|
|
Open a new Power BI report and select Transform Data.

In the Power Query Editor window that appears click the New Source button (not the drop down).

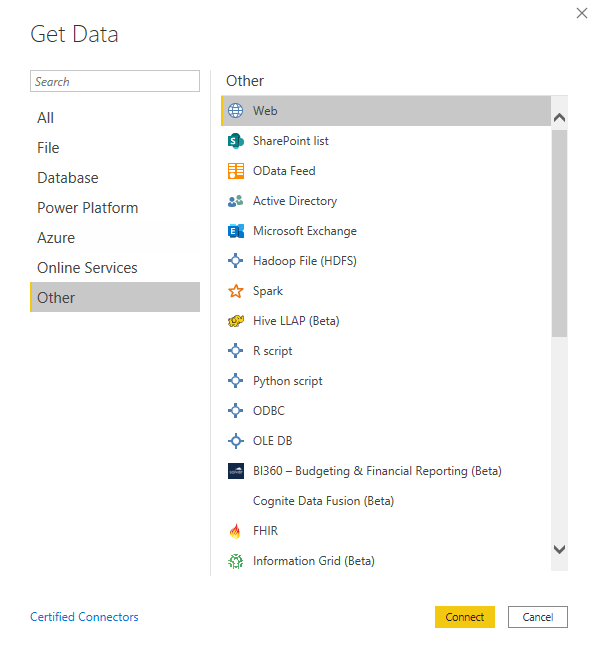
In the Get Data window select Other > Web then Connect. Yes, there is a connector for GitHub but it is used to get data about a repository, not data in a repository.
Paste the first URL in the box and click OK.

Power BI will load the data into a preview window. Review and if everything looks good click OK. We will then be back to the Power Query Editor where we need to clean up a few things.
First we have to adjust the Source step because each day the CSSE team adds a new column for that day of data. Click on the Source step and then in the formula bar delete the Columns=###, section. Without this step, new columns will not be added to the model when they are added to the files in the repository.

Next delete the Changed Type step that Power Query added for us. We will set the types that we want later.
The first row of the file contains the column names. Let Power Query know by clicking Use First Row as Headers on the Transform tab.

Power Query will try to be helpful and add another Changed Type step. Delete it again.
Now we will unpivot the value for each date. Hold down the shift key and select the column Province/State and then Long. Right-click on one of the highlighted columns and select Unpivot Other Columns.
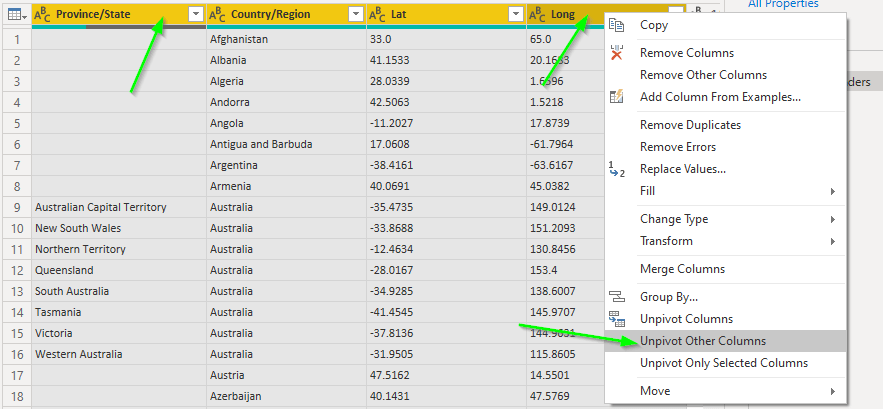
Power Query makes this too easy! See how I accomplished this same step in SQL here.

Right-click on Attribute and rename it ReportDate. Right-click on Value and rename it Count.
Next we will set the correct data type for these columns.
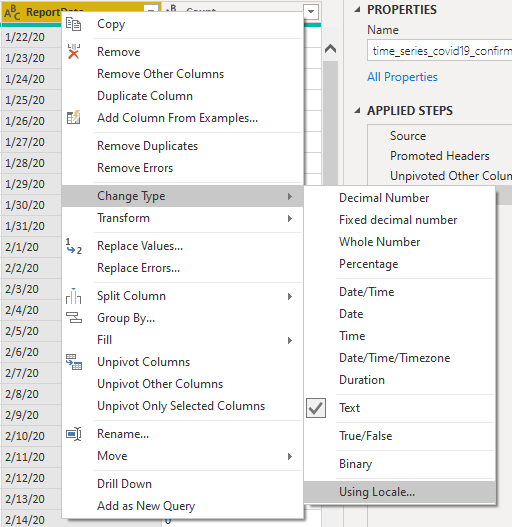
Because the format of the date is in the US syntax of MM/DD/YY we have to specify which locale to use or risk having errors if users with a non-US locale attempt to load the data. Right-click on ReportDate and select Change Type > Using Locale...
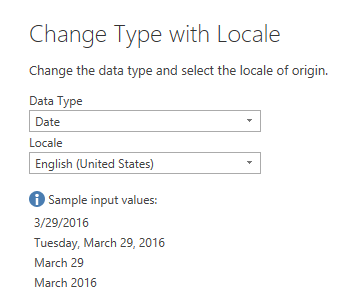
Set the Data Type to Date and the Locale to English (United States).
Right-click on Count and change type to Whole Number. Then right-click on Lat and Long and change type to Decimal Number.
Let’s also rename the descriptive columns. Rename the following:
Province/State=StateCountry/Region=CountryLat=LatitudeLong=Longitude
Clean your data!
Now that we have the data in a format that will be useful we should do some basic data cleansing. First up, let’s replace the blank values in State with something more useful. Right-click on State and select Replace Values...
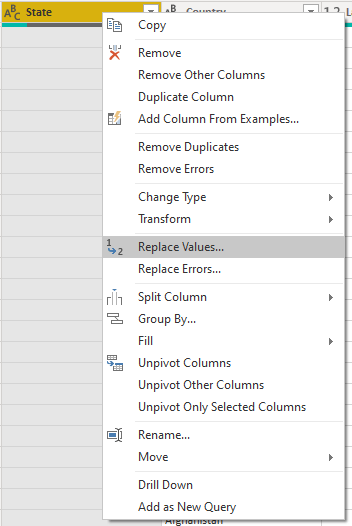
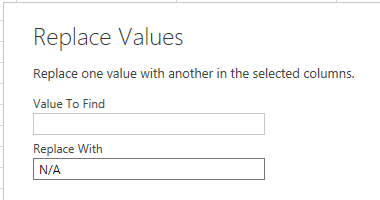
For Value To Find leave it empty and type N/A in the Replace With box.
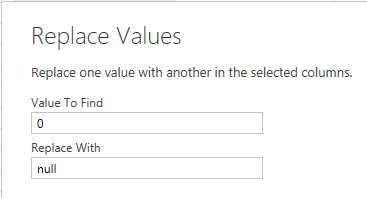
This data set uses a Latitude and Longitude of 0 in some cases where a more specific value is not available. This can distort results when trying to map values so we will want to replace the 0 with a blank value. Right-click on Latitude and select Replace Values.... For Value To Find type 0 and type null in the Replace With box. Repeat for Longitude.
Create some keys!
Because we want to create a proper star-schema with this model we need to create some keys. We will want to be able to link data from the Confirmed file with data from the Deaths and Recovered file by Geography and Report Date.
We also want to guard against data-entry problems here. Because Power Query is case sensitive and humans are not, we will create an upper-case key based on Country and State.
On the Add Column tab of the ribbon click the Custom Column button.
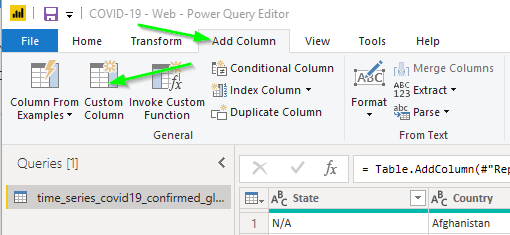
Set the new column name to SourceGeographyID and enter this code in the formula box.
|
|
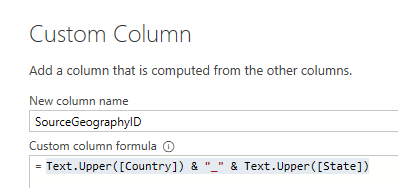 We can use the
 SourceGeographyID column to join the Geographies together properly and form the basis of a Geography dimension. We still need to be able to join the Geography and days together from the different files. Add another Custom Column and name this one SourceGeographyID_ReportDate with this code in the formula box.
|
|
Now we should have everything we need to join the multiple files properly and to create a Geography dimension.
Organize
Now is a good time to organize things a bit.
Rename this query Global Confirmed Source by typing the new name in the Name box on the right.
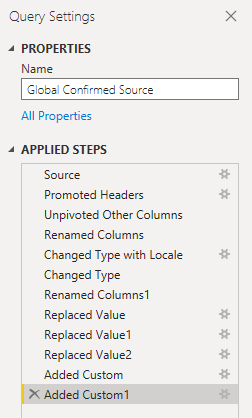
Move the query to a new group by right-clicking on it and selecting Move To Group > New Group and name the group Source.
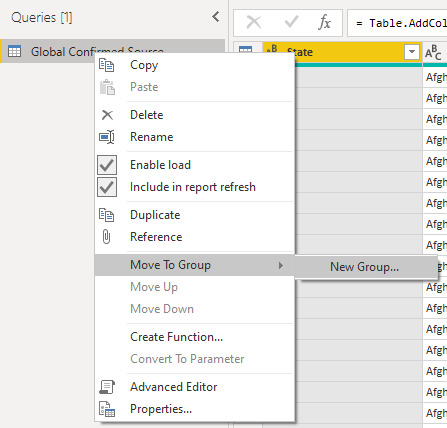
We will not actually load the data directly in this query, but we will use it as a reference to load other tables. To prevent the report from storing multiple copies of the data right-click on the query and deselect Enable load. Click OK on the warning that may pop up.
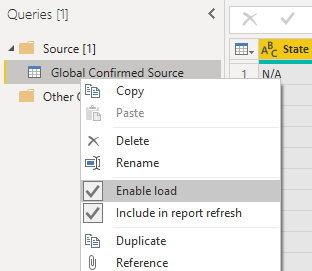
Repeat
We also want to bring in the other two files. We can easily copy the first query and edit a few places to make it work.
Right-click on the Global Confirmed Source query and select Duplicate. Rename the new query to Global Deaths Source. In the Applied Steps window edit the Source step to use the next URL for the deaths file. Repeat for the recovered file.

Create a single fact table
At this point we have queries for the three Global Time Series files. All of the columns look the same and we would like to get the data from all three files into one table that we can use for calculations. We can do this by selecting the first two queries (Confirmed and Deaths) and clicking the Merge Queries > Merge Queries as New button in the ribbon.

To make sure we get all records from every file we will want to use a Full Outer join with the join key on the SourceGeographyID_ReportDate column that we made earlier.
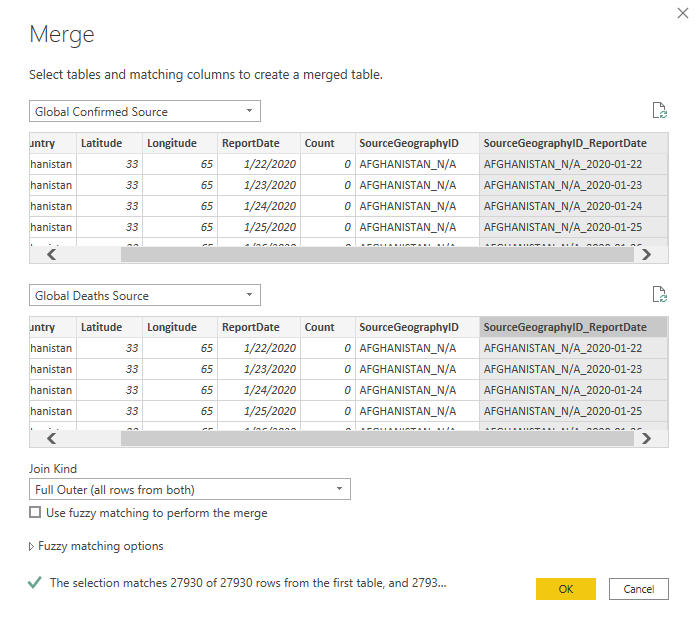
Name the new query Global Total. Rename the Count column Confirmed.
The last column in the table now represents all of the columns from the second query that we merged. We want to add these columns and then clean up a bit before adding the third query. Click on the button in the column header and make sure Expand is selected as well as All Columns then click OK.
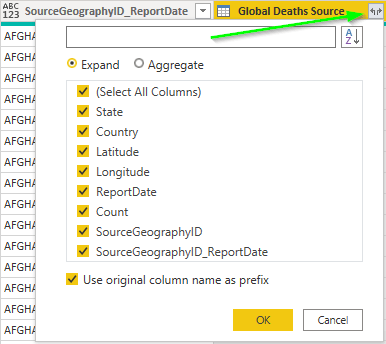
Rename the Global Deaths Source.Count column Deaths.
NULLS!
Replace null values for each of the columns from the first set with the value from the second set. Because we handled blank values in each source query, the only way to get a null value is if the join failed. Unfortunately, this is a tedious task and the easiest way to do it is to manually edit the M code by using the Advanced Editor. (GUI’s always seem to fall down at some point, don’t they?)
Thank you to Miguel Escobar for posting this method here and how to restore the data types here.

|
|
Line 5 should already exist and just needs a comma on the end. Lines 6-12 are replacing the value if it is null with the value from the Global Deaths Source query. Line 13 restores the data types that get lost due to lines 6-12. Then line 14 removes the Global Deaths Source columns since we no longer need them.
Wasn’t that fun?
Good, because we get to do it again! Now we need to merge the Recovered query with this one. Select Merge Queries > Merge Queries and add in the Global Recovered Source query. Like before, use a Full Outer join and merge on the SourceGeographyID_ReportDate column.

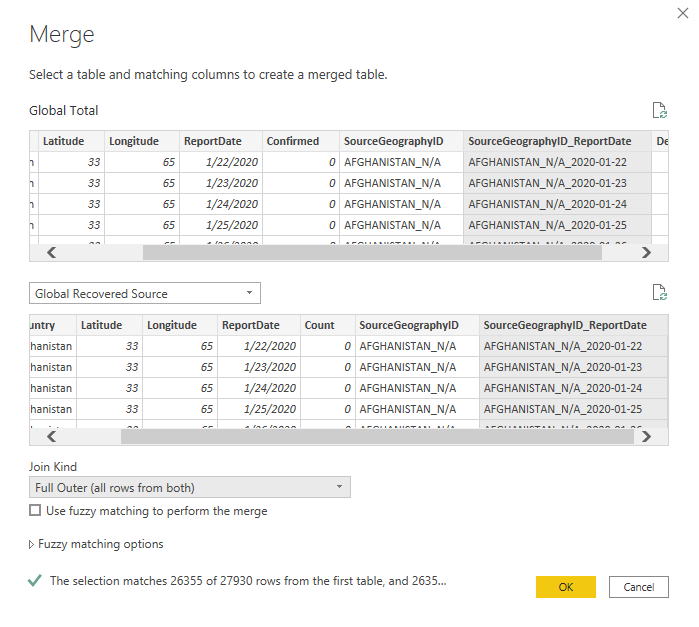 Expand the
 Global Recovered Source table just like earlier.
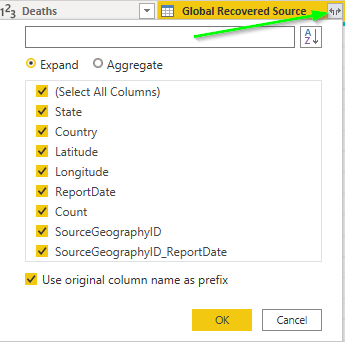 And then rename the
 Global Recovered Source.Count column to Recovered.
Click on advanced editor, and use the following code.
|
|
Line 17 just has a comma added to the end. Line 18-25 replace the nulls with the value from the Recovered query and then line 26 restores the data types again.
One last step is to replace null values in the Confirmed, Deaths, and Recovered counts with 0.
Hold the ctrl key while selecting each of the three columns then right-click on one of them and select Replace Values. Type null in the Value To Find box and 0 in the Replace With box.
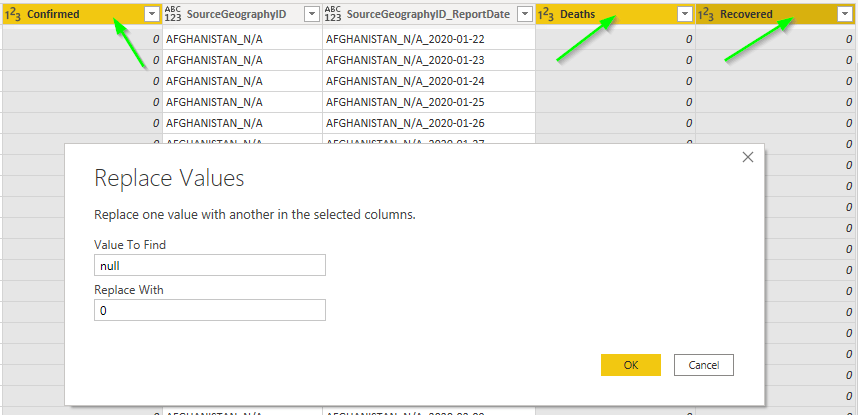
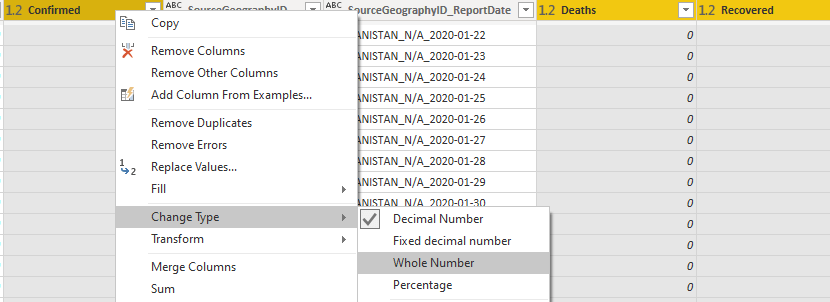
This replace step causes the data type of these columns to change to decimal. Because people cannot be partially infected, dead, or recovered let’s change it back to a whole number. If the columns are not still selected, once again hold the ctrl key while selecting each of them then right-click on one and select Change Type > Whole Number.
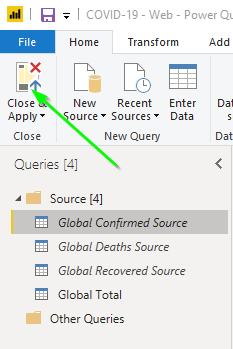
Now we have all three queries into one table we have enough to do a basic load and begin some analysis. Click Close and Apply on the ribbon and return to the Power BI window.
In the next post, we will add dimensions and then actually start writing measures to analyze the data.