This is the third post in a series on building a Power BI report on the COVID-19 data. The source of the data is the COVID-19 Data Repository by the Center for Systems Science and Engineering (CSSE) at Johns Hopkins University. This post builds on the foundation from the previous steps.
- Part 1: Import COVID-19 Data with Power BI
- Part 2: Create a Star Schema with COVID-19 Data in Power BI
- Part 3: Create Simple Reports on COVID-19 Cases with Power BI (This Post)
- Part 4: Modeling Active COVID-19 Cases with Advanced DAX in Power BI
In the previous post we created a star-schema on the COVID-19 time series data. We created three measures to accurately calculate the number of confirmed cases, deaths, and recovered cases as reported by the CSSE. In this post we will explore the data by adding visuals and creating additional calculations.
Simple Layout
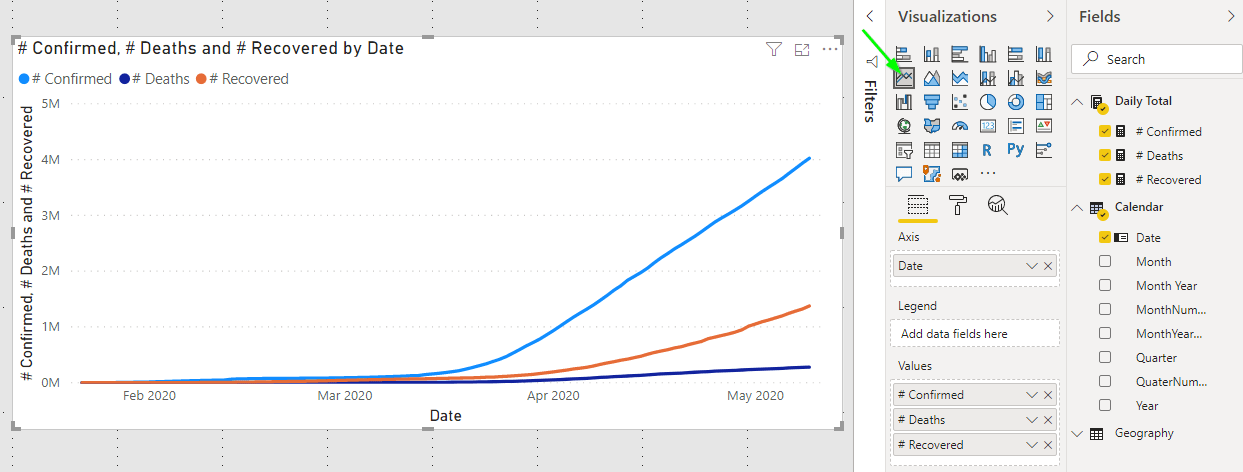
We will begin by creating a simple line chart. With a blank canvas click the Line Chart visual button and add the three measures # Confirmed, # Deaths, # Recovered to the Values and Calendar[Date] to the Axis. Power BI does a good job of making this look nice without much effort.
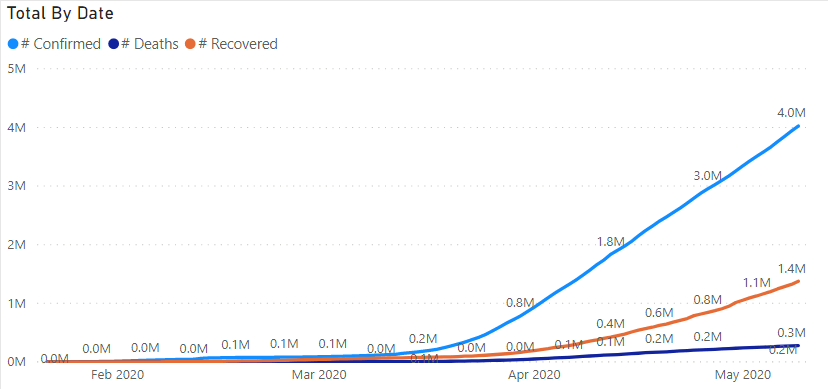
We can help to remove some visual clutter by removing the repeated information in the axis titles and chart title. In the format pane of the visual go to X Axis and Y Axis and turn off the Title for each. Then go to the Title section and type Total By Date. Next turn on Data Labels. These changes help to focus the user’s eye on the import information.
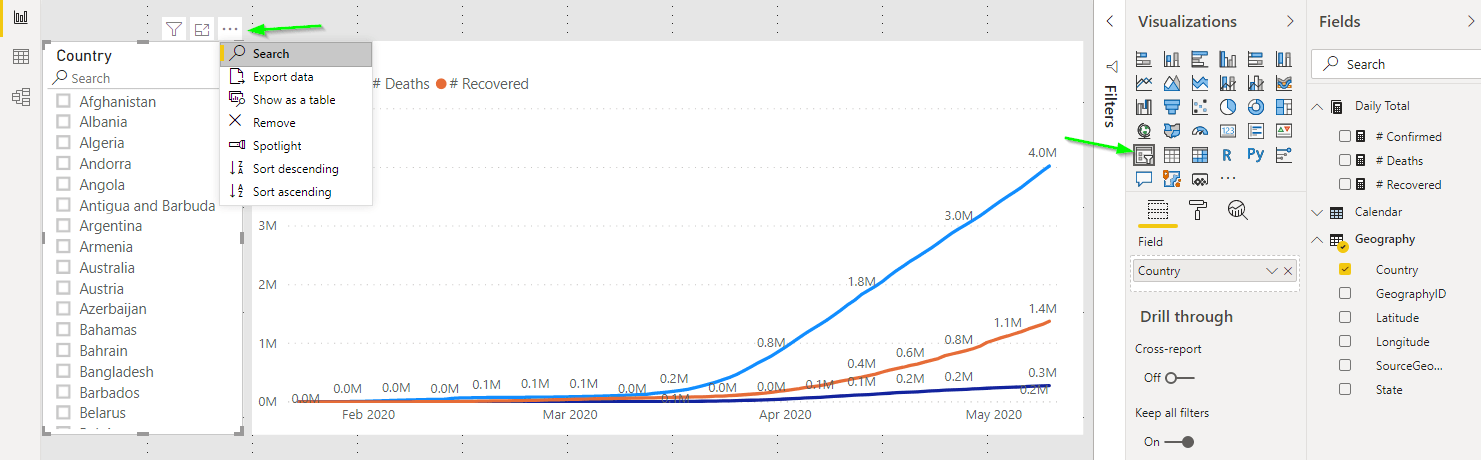
Next we will add a slicer so we can look at individual countries. Do this by clicking a blank area of the canvas (so that the line chart is not selected) and then clicking the Slicer visual. Add Geography[Country] to the field and position on the screen to the left of the Total By Date chart. Add Search to the slicer by clicking the ellipses next to the top-right and select Search.
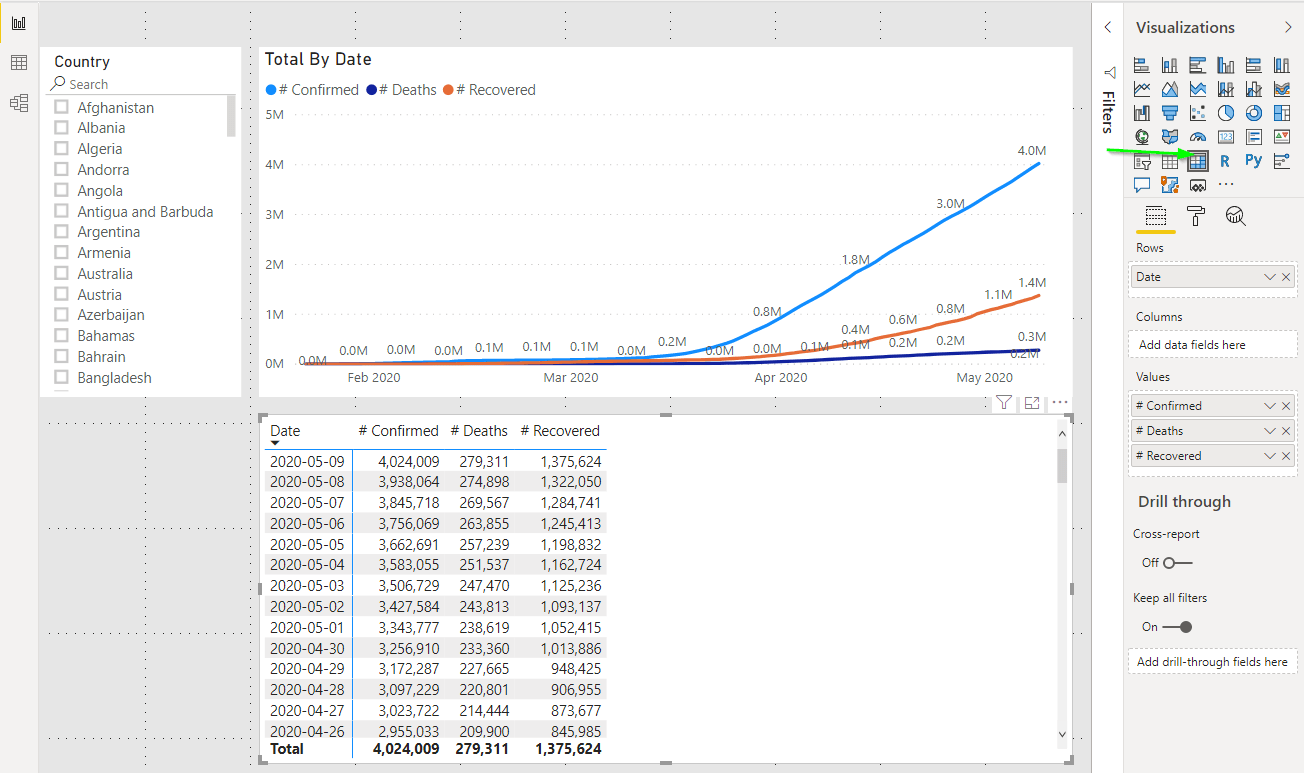
Let’s add one more visualization to display the numeric value of what is represented in the line chart. This will be helpful in discussing the next layer of calculations. Right-click on the line chart and select Copy > Copy Visual then paste it by pressing ctrl-v. Drag it down below the Line chart and while it is still selected click on the Matrix visual. This will change the second line chart into a matrix where you can see the numbers. Next click on Date to make it sort descending.
Additional Calculations
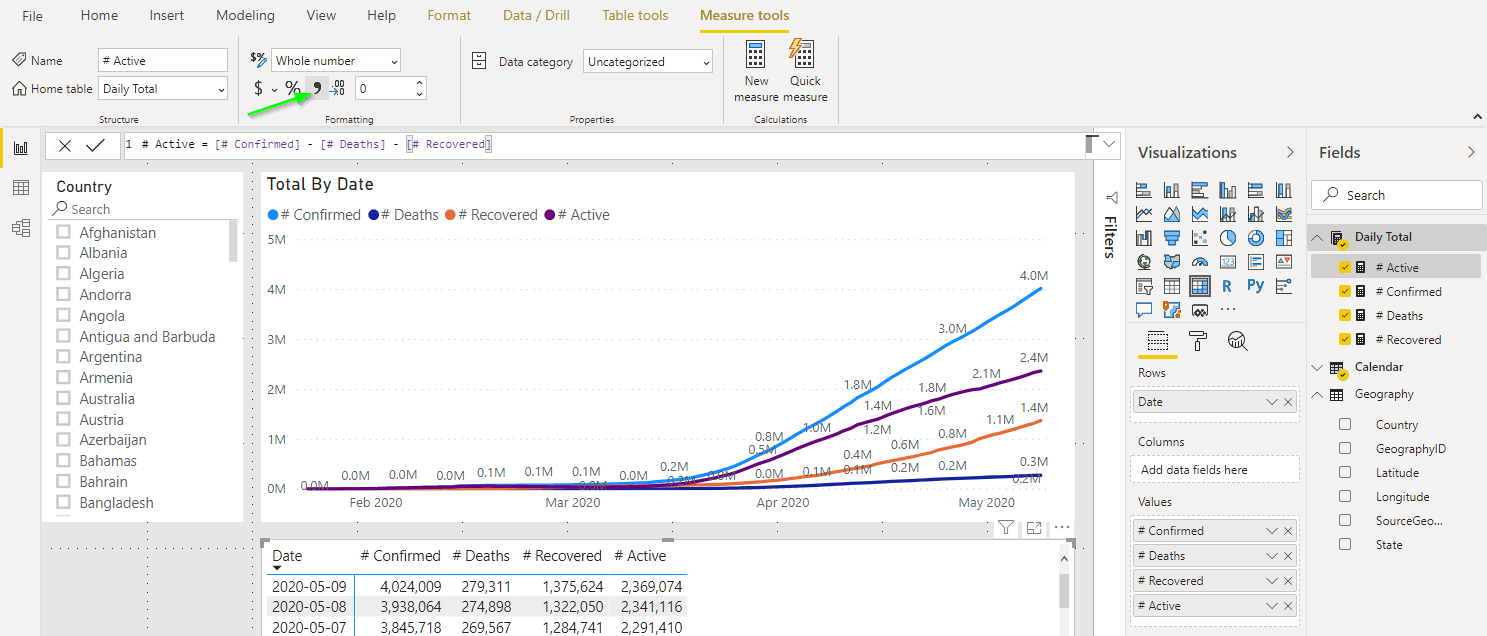
Now we shall expand on these calculations. First let’s add an active count by taking the # Confirmed and subtracting the # Deaths and # Recovered. Right-click on the Daily Total table and select New Measure then enter the following in the formula bar. Set the formatting on it to show thousands.
|
|
Add it to both the line chart and the matrix.
Another good calculation is to find the number of new events on each day. This calculation is a bit more complex, but easy to understand with a little DAX. We will break it up into two parts and add each one as a new measure because they are both useful calculations to have on their own.
- What was the total for the previous day?
- What is the difference between the current day and the previous day?
The total for the previous day can be calculated like this.
|
|
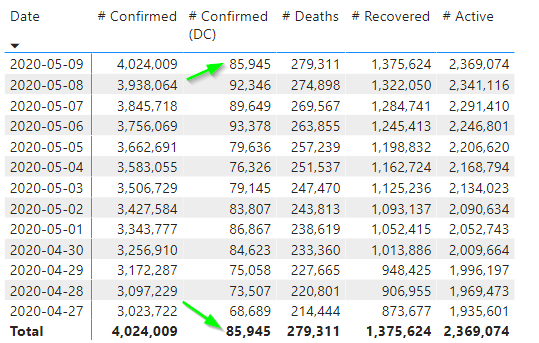
This calculation uses the existing # Confirmed measure and changes the context of it by shifting it back one day. Once this value is known it is easy to subtract the current and previous day totals.
|
|
Note how the total line is still correct and matches the value for 2020-05-09 (the last date that I have processed).
DIY: Add Previous Day and Daily Change calculations for both # Deaths and # Recovered.
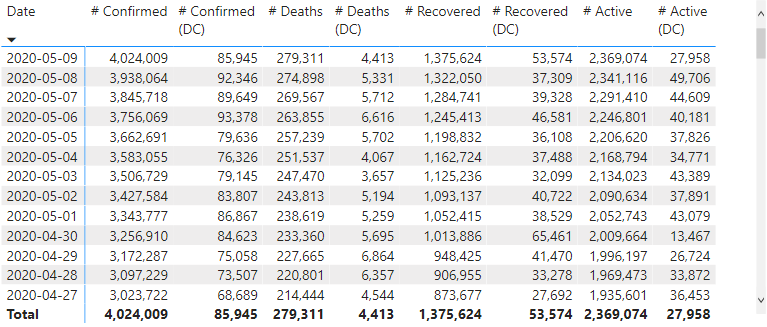
Once you have the Previous Day values for each of the three base measures you can also create a Daily Change value for the # Active.
|
|
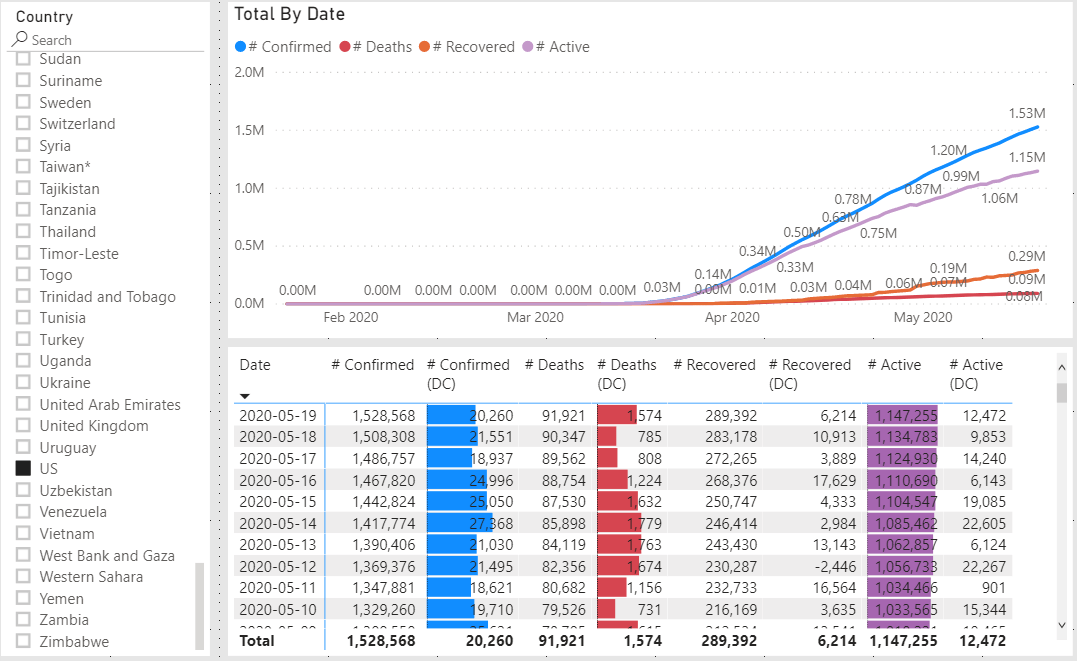
Adding these Daily Change values to the matrix results in a dense visual that can be difficult to understand at a glance.
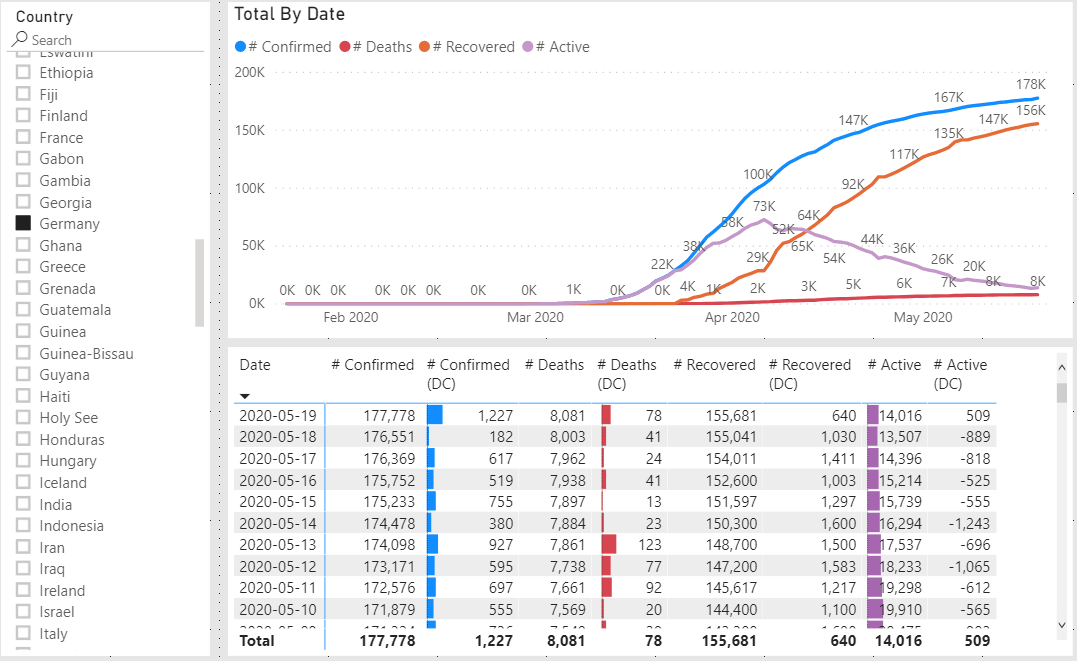
 We can illustrate trends by using conditional formatting on the columns. Select the matrix visual and then use the formatting pane to add data bars to the columns.
Don’t go crazy, try to add data bars only for columns where you have to. Also try to keep the colors consistent between the visuals.
If we slice the data to just look at Germany we can see a nice graph of how the number of active cases goes down as the number of new confirmed cases slows down and the number of recovered and, unfortunately, deaths go up.
The same cannot be said of the US data. This is primarily due to a lack of solid reporting around the number of recovered cases.
In the next post I will show how to estimate the number of active cases by making some assumptions and expanding the data model.